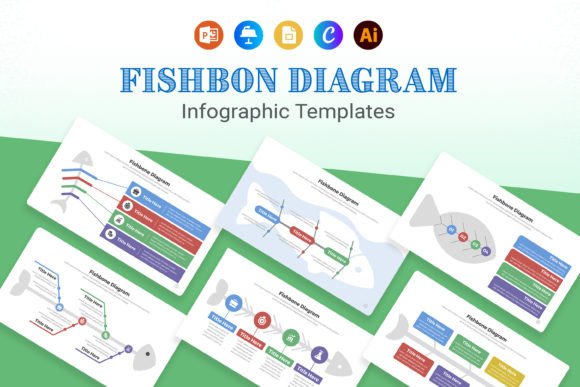
Visualize Complex Processes with Fishbone Diagram Infographic Templates
Transforming Data into Actionable Insights
When you're trying to solve a problem or analyze a process, raw data and bullet points often fail to capture the complexity of the situation. This is where visual tools become indispensable. A Fishbone Diagram, also known as an Ishikawa or cause-and-effect diagram, is a powerful method for identifying the root causes of a specific outcome. However, creating these diagrams from scratch can be time-consuming and often results in a cluttered, unprofessional look. Our Fishbone Diagram Infographic Templates solve this by providing a structured, visually appealing framework that you can populate with your own data in minutes.
These templates are designed with clarity and hierarchy in mind. The "spine" of the fish represents the main problem or effect, while the "bones" branch out to categorize potential causes—such as methods, machines, people, materials, measurements, and environment. This logical structure forces you to think systematically about every contributing factor. Because the layout is already balanced and the typography is pre-selected for readability, you bypass the most difficult design challenges. You get a premium font pairing and a clean color scheme that ensures your information is digestible at a glance, whether it's presented in a boardroom, a classroom, or a webinar.
Why Visual Hierarchy Matters in Analytical Design
The effectiveness of an infographic isn't just about the data; it's about how the eye moves across that data. A well-designed Fishbone Diagram Infographic Template establishes a clear visual hierarchy. The main header, typically set in a bold display font, immediately signals the topic. The category headers along the fishbones use a distinct sans serif font or serif font to separate them from the body text, which is optimized for smaller sizes. This layering of typefaces isn't arbitrary—it guides your audience from the big picture to the granular details without causing cognitive overload.
For entrepreneurs and project managers, this hierarchy translates directly into faster decision-making. When you present a project delay or a product defect using a structured diagram, stakeholders can instantly see which category (e.g., "People" or "Process") holds the most significant issues. This eliminates the ambiguity of a spreadsheet. The templates are built to support this clarity. They utilize modern typography trends—such as geometric sans serifs and clean line icons—that convey professionalism and objectivity. This isn't just a creative font choice; it’s a strategic tool for brand identity, ensuring that your internal documents and external presentations maintain a consistent, authoritative voice.
Practical Applications Across Industries
The versatility of these templates is one of their strongest assets. They are not limited to corporate quality control. Educators can use them to teach biological processes or historical cause-and-effect relationships. Healthcare professionals might map out patient journey bottlenecks. Marketers can analyze campaign performance, breaking down "Reach" or "Conversion" into specific sub-causes like ad copy, audience targeting, and platform algorithms. The adaptability of the layout means it functions as a universal design asset.
Consider a small business owner analyzing customer churn. Using a Fishbone Diagram Infographic Template, they can visually map out factors like "Customer Service," "Pricing," and "Product Quality." By filling in the bones of the diagram, patterns emerge that might be missed in a linear list. Furthermore, because these templates are editable in PowerPoint, Google Slides, and Adobe Illustrator, you can easily integrate them into your existing workflow. You can match the colors to your brand palette, swap the typeface for your corporate logo design font, and export the final result as a PDF for reports or a PNG for social media graphics. This flexibility ensures that your analytical tools look as polished as your marketing materials.
Choosing and Customizing Your Template
When selecting a template, focus on the complexity of your process. If you have many sub-causes, choose a template with more branching levels to avoid overcrowding. Look at the included styles; a good template pack often includes variations in color (light and dark modes) and layout (horizontal vs. vertical spines). Since the templates use 100% editable vectors, you aren't locked into the initial design. You can adjust the thickness of the lines, the size of the text boxes, and the overall scale to fit your specific content volume.
Readability is paramount. While a script font or handwritten font might look appealing for headers in some contexts, an analytical diagram usually benefits from a clean sans serif font for the detailed text to ensure legibility at smaller sizes. Test your content within the template before finalizing. Does the text fit comfortably within the "bones"? Is there enough white space to prevent the diagram from looking like a wall of text? By treating these templates as a starting point rather than a rigid mold, you leverage the best of modern typography and structural design to create a tool that is both beautiful and brutally effective at solving problems.